

 Research into athletics spending has never been easier for college sports media thanks to both the Knight Commission on Intercollegiate Athletics and the USA Today athletics/coaches’ salary databases. These resources enable college sports journalists to compare finances in order to develop numerous comparisons. This morning, for example, I played with financial data related to both our school (Eastern Illinois University) and our conference (Ohio Valley) that has yielded information for at least a few stories worth investigating.
Here is a sampling of data about EIU’s spending based upon 2012 finances from the Knight Commission database: EIU ranks ninth among 10 OVC schools in total athletic spending at $29,159 per FTE. [Data for Belmont and SIU-E were unavailable.] Southeast Missouri spent $259 less overall per FTE than EIU does. EIU spent $12,550 more on athletics (FTE) than on academics. In this category, EIU ranks at the bottom. Murray State, Tennessee State, Tennessee Tech and Jacksonville State, meanwhile, each spent more than $30,000 more per FTE on athletics than on academics.
Once I look over all of the data, I suspect the OVC will be at, or near, the bottom of conferences in athletic spending per FTE. The Southeastern Conference, conversely, will be at, or near, the top in athletic spending. In the SEC, Auburn spent $225,595 on athletics per FTE, which is $198,738 more than it spends on academics per FTE. Four SEC schools spend more than $200,00 on athletics per FTE. Ole Miss is at the bottom, spending $135,008 per FTE, which is more than $120,000 more per FTE than it spends on academics.
If this data seems confusing, that might be because these figures are presented rather dryly. Like all stories, this one needs context, which means I’d need to speak with coaches, athletes and administrators, to read stories on athletics budgets and to observe stadiums, locker rooms and other facilities on campus in order to find a storyline. Data should serve as the foundation to support these stories.
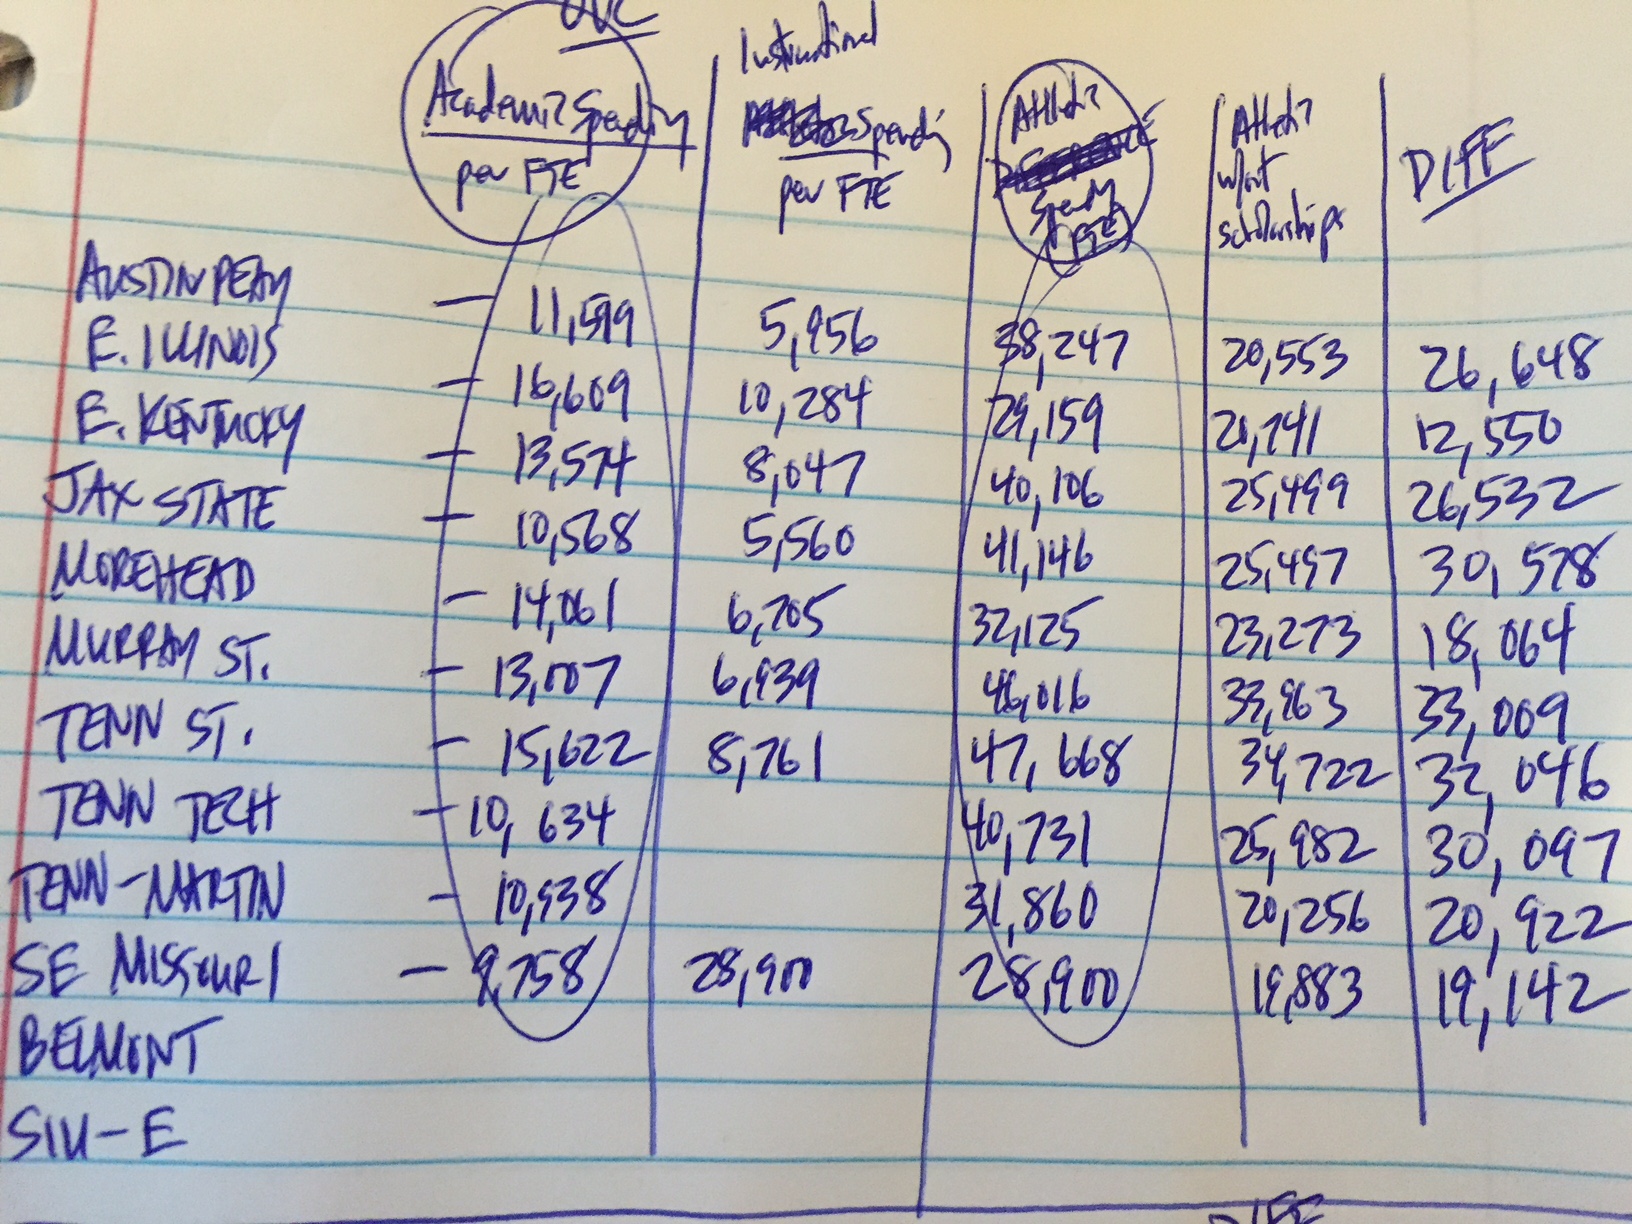 No need to take on all the data at once. Start small, building on one aspect and then moving from there. For instance, you might want to begin with a comparison between academic spending per FTE and athletic spending per FTE. Afterward, you might want to create a third column that includes the difference between these figures. Here’s what I recorded for the OVC (see picture on the right).
Were I writing a story, I would then rank the data by whatever category I deemed most important, or I would cite the schools in alphabetical order and offer the three columns in a well-designed graphic.
This information does not offer the entire perspective on sports at EIU nor in the Ohio Valley Conference. But it’s something you can build on in the coming weeks or months – and everybody would be the better for these stories.
